How to use Scenario Manager in Excel
Forecasting and calculating predications from a dataset can be quite challenging. Fortunately Microsoft Excel provides a fast and efficient solution known as Scenario Manager. Using this takes varying data sets to give a range possible outcomes.

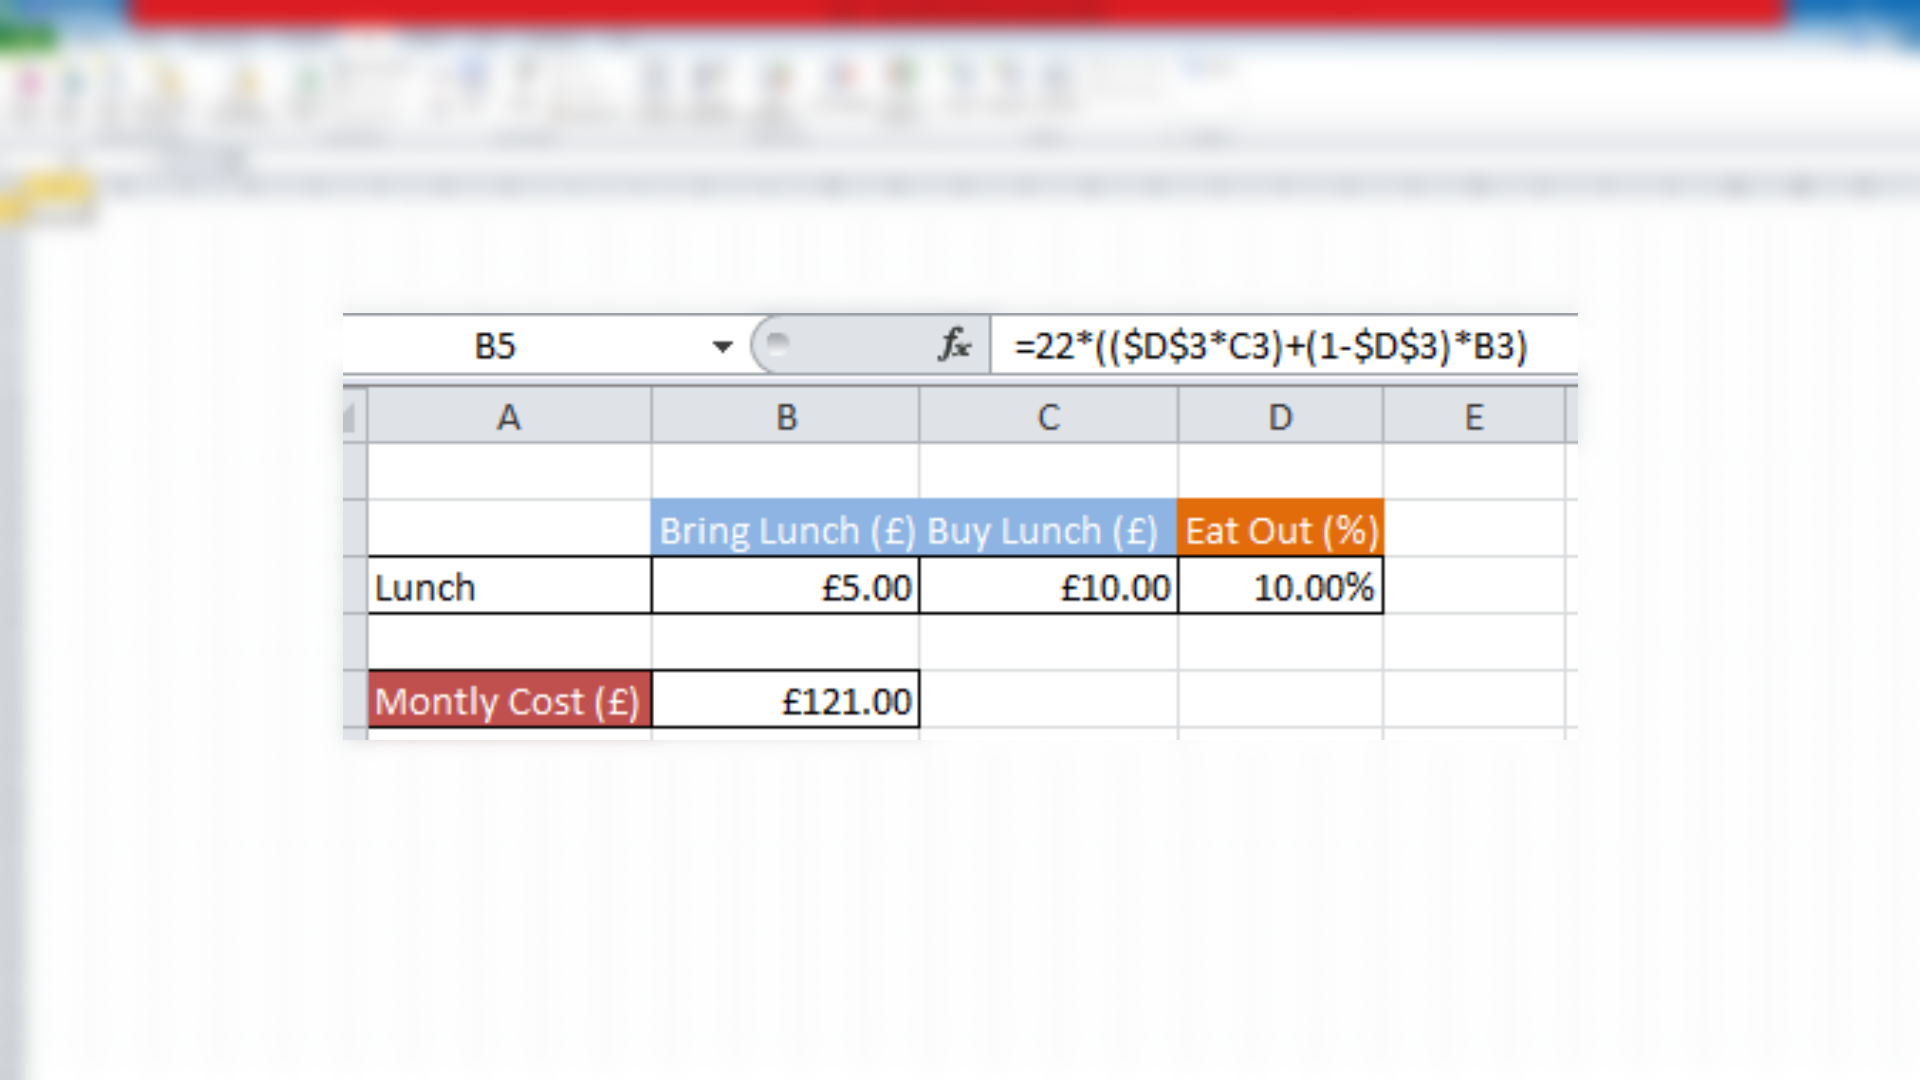
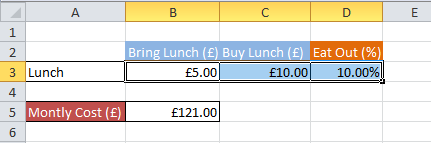
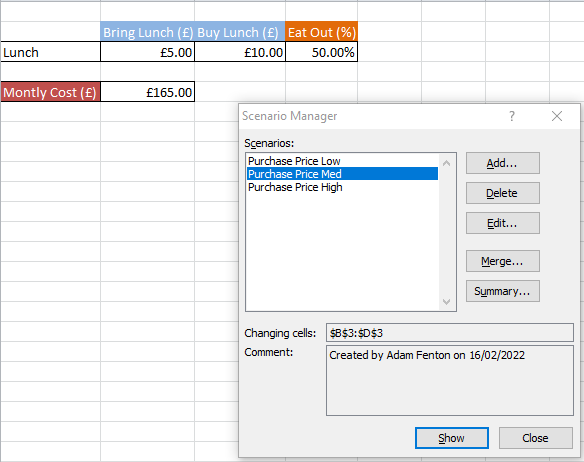
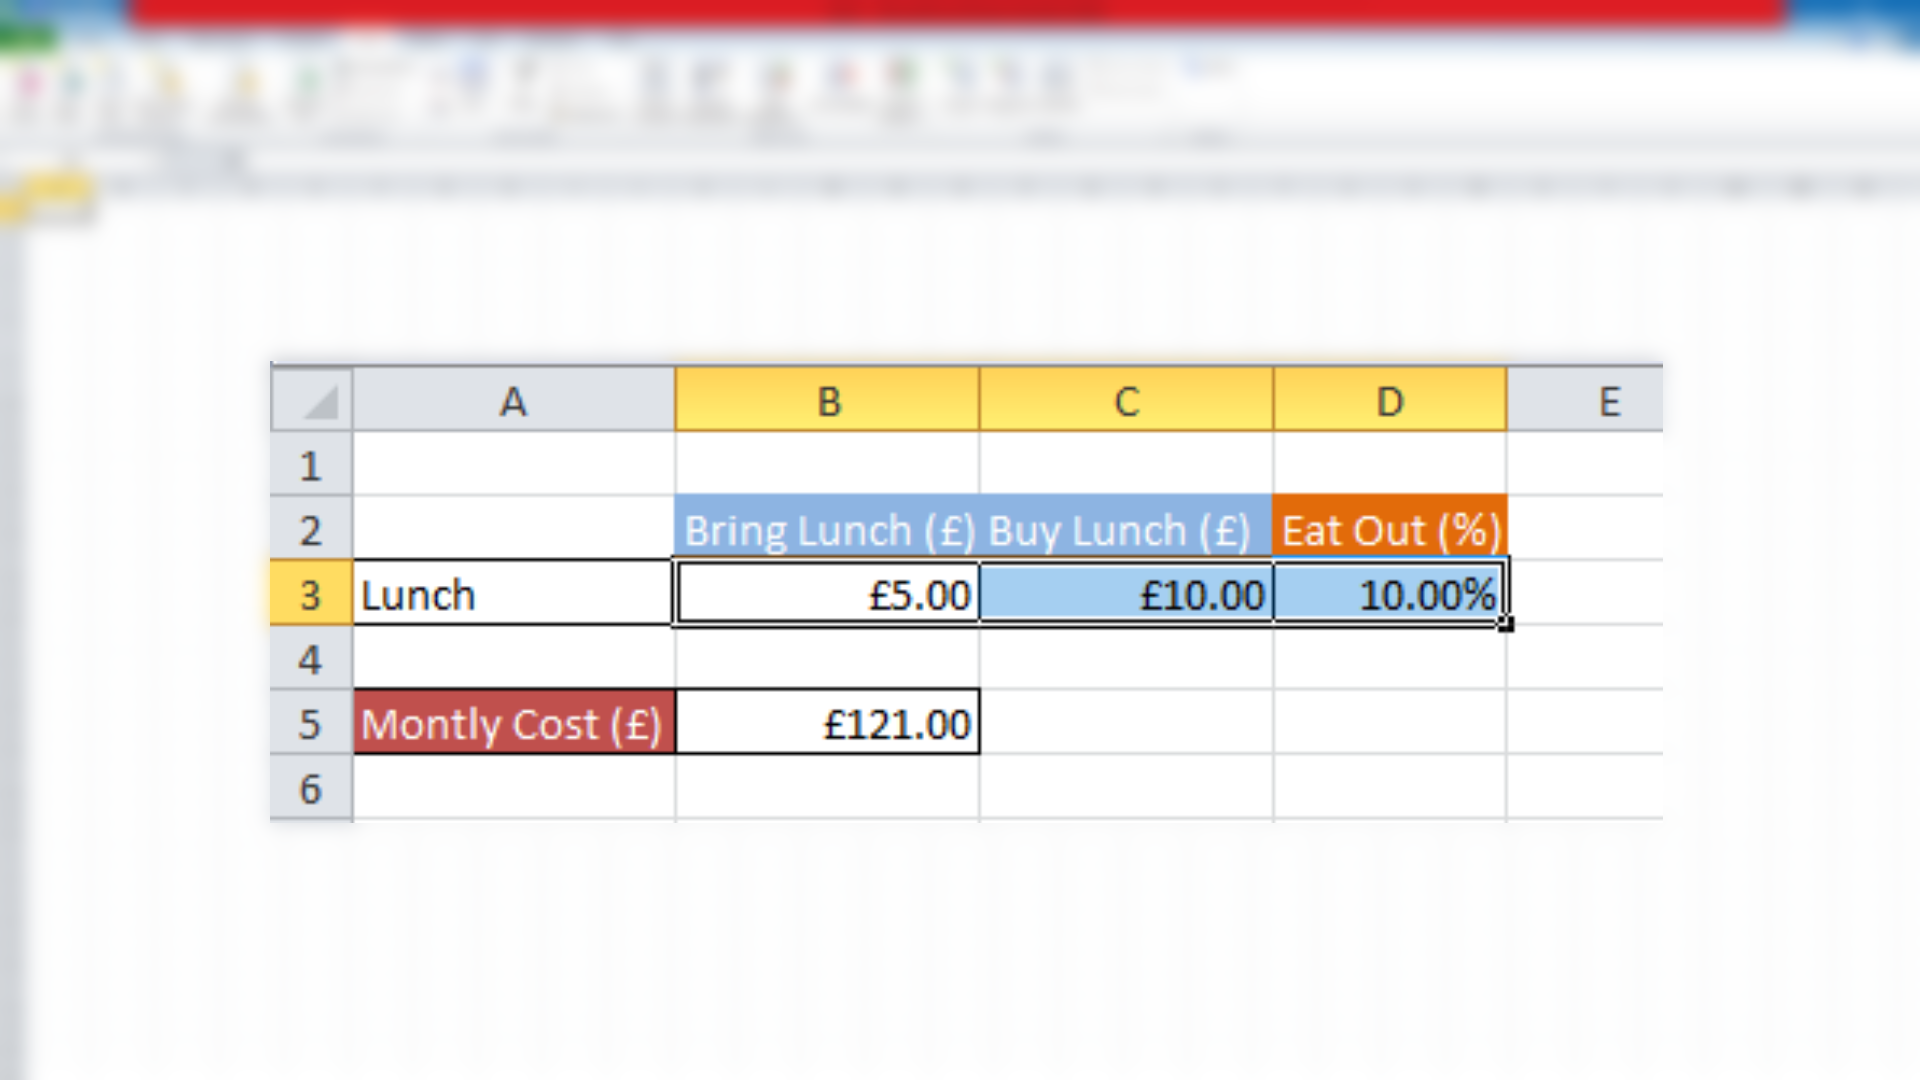
Existing Data Set
Firstly, you need a set of data to work with. This data needs to reflect possibilities as shown above in the example. My data shows the cost of bringing your own lunch to work compared to buying food out. A % cell is the chance that I will be buying food at work. This % chance is reflected in the Monthly Cost.
Calculating your total
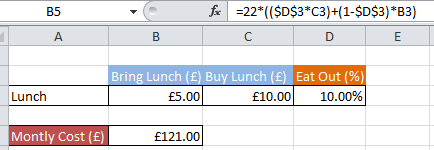
In my example above, to calculate the total monthly cost I used the following sum: =22*(($D$3*C3)+(1-$D$3)*B3)
Simply, this will multiply my % by the eat out cost initially, adding on 1 negative the % value multiplied by the bring your own lunch value to give your monthly cost.
You should modify the formula for your own data as required.
Creating Scenarios
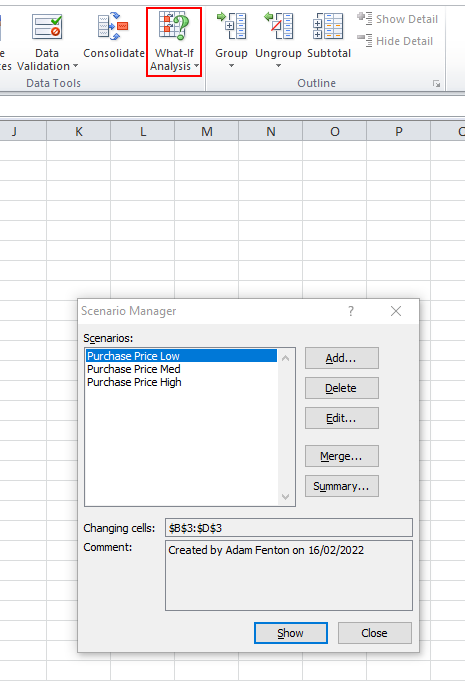
To create a scenario based on your dataset, firstly select the cells containing data will be changed and will affect the formula being used to calculate the total. In the example, above, the % cell.

Next, navigate to the data tab on the top ribbon and under data tools select what if analysis and Scenario Manager.
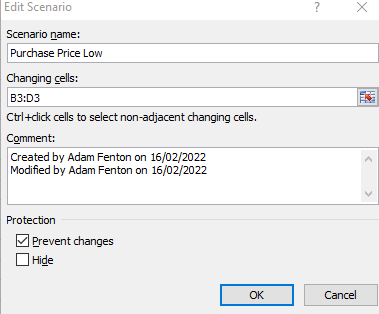
Adding/editing scenarios
Click add to create a new scenario or edit with an existing scenario selected. Enter a name for the scenario. The cells to be changed will be shown in this box from the range highlighted earlier. Optionally, add a comment relating to the scenario.
If you require the scenario to not be editable to be hidden once workbook protections is enabled then check the relevant boxes and click OK to proceed.
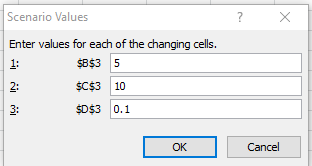
Modifying cell data
This next window allows the user to define the data specific to the selected cells for this scenario. Referring back to my example above, I can set cell D3 to 0.1 = 10%.
Repeat these steps to add as many Scenarios for your data as required.
Viewing scenario predictions
There are two ways to predictions generated by scenarios. The 1st is to select one of your scenarios and to click show, this will change the data in the cells you have setup to that defined in the scenario you selected and it will calculate that and display that correctly as the total using your formula.
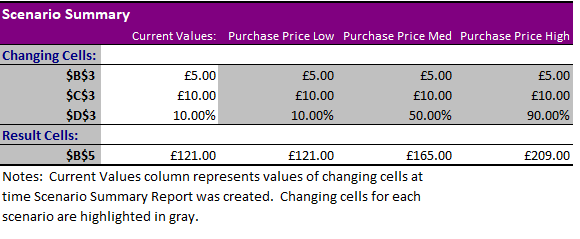
The 2nd way is to generate a summary.
Click summary, this window gives you the option to display the results of all your scenarios in two different formats, a pivot table or regular summary table. Both examples are shown below
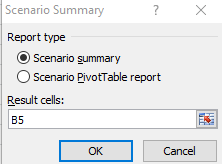
Note: These will need to be generated each time a change is made to a scenario or your data, they do not update automatically.
Existing Data Set
Firstly, you need a set of data to work with. This data needs to reflect possibilities as shown above in the example. My data shows the cost of bringing your own lunch to work compared to buying food out. A % cell is the chance that I will be buying food at work. This % chance is reflected in the Monthly Cost.
Calculating your total
Simply, this will multiply my % by the eat out cost initially, adding on 1 negative the % value multiplied by the bring your own lunch value to give your monthly cost.
You should modify the formula for your own data as required.